Hex
BETAIn this section, we provide guides and references to use the Hex connector.
Configure and schedule Hex metadata and profiler workflows from the OpenMetadata UI:
Ingestion Deployment
To run the Ingestion via the UI you'll need to use the OpenMetadata Ingestion Container, which comes shipped with custom Airflow plugins to handle the workflow deployment. If you want to install it manually in an already existing Airflow host, you can follow this guide.
If you don't want to use the OpenMetadata Ingestion container to configure the workflows via the UI, then you can check the following docs to run the Ingestion Framework in any orchestrator externally.
Run Connectors from the OpenMetadata UI
Learn how to manage your deployment to run connectors from the UIRun the Connector Externally
Get the YAML to run the ingestion externallyExternal Schedulers
Get more information about running the Ingestion Framework ExternallyRequirements
Hex connector supports both personal and workspace tokens for authentication.
Hex Account Setup
Follow the steps below to configure the account setup for Hex connector:
Step 1: Generate API Token
To generate an API token in Hex:
- Log into your Hex account
- Navigate to Account Settings
- Go to the API Keys section
- Click on "Create API Key"
- Choose the token type:
- Personal Token: Provides access to projects you own or have access to
- Workspace Token: Provides access to all projects in the workspace (requires admin privileges)
- Copy and securely store the generated token
API tokens are shown only once when created. Make sure to copy and store them securely.
Step 2: Verify API Access
Ensure that the token has appropriate permissions:
- For personal tokens: Verify you have access to the projects you want to ingest
- For workspace tokens: Verify admin privileges are granted
Metadata Ingestion
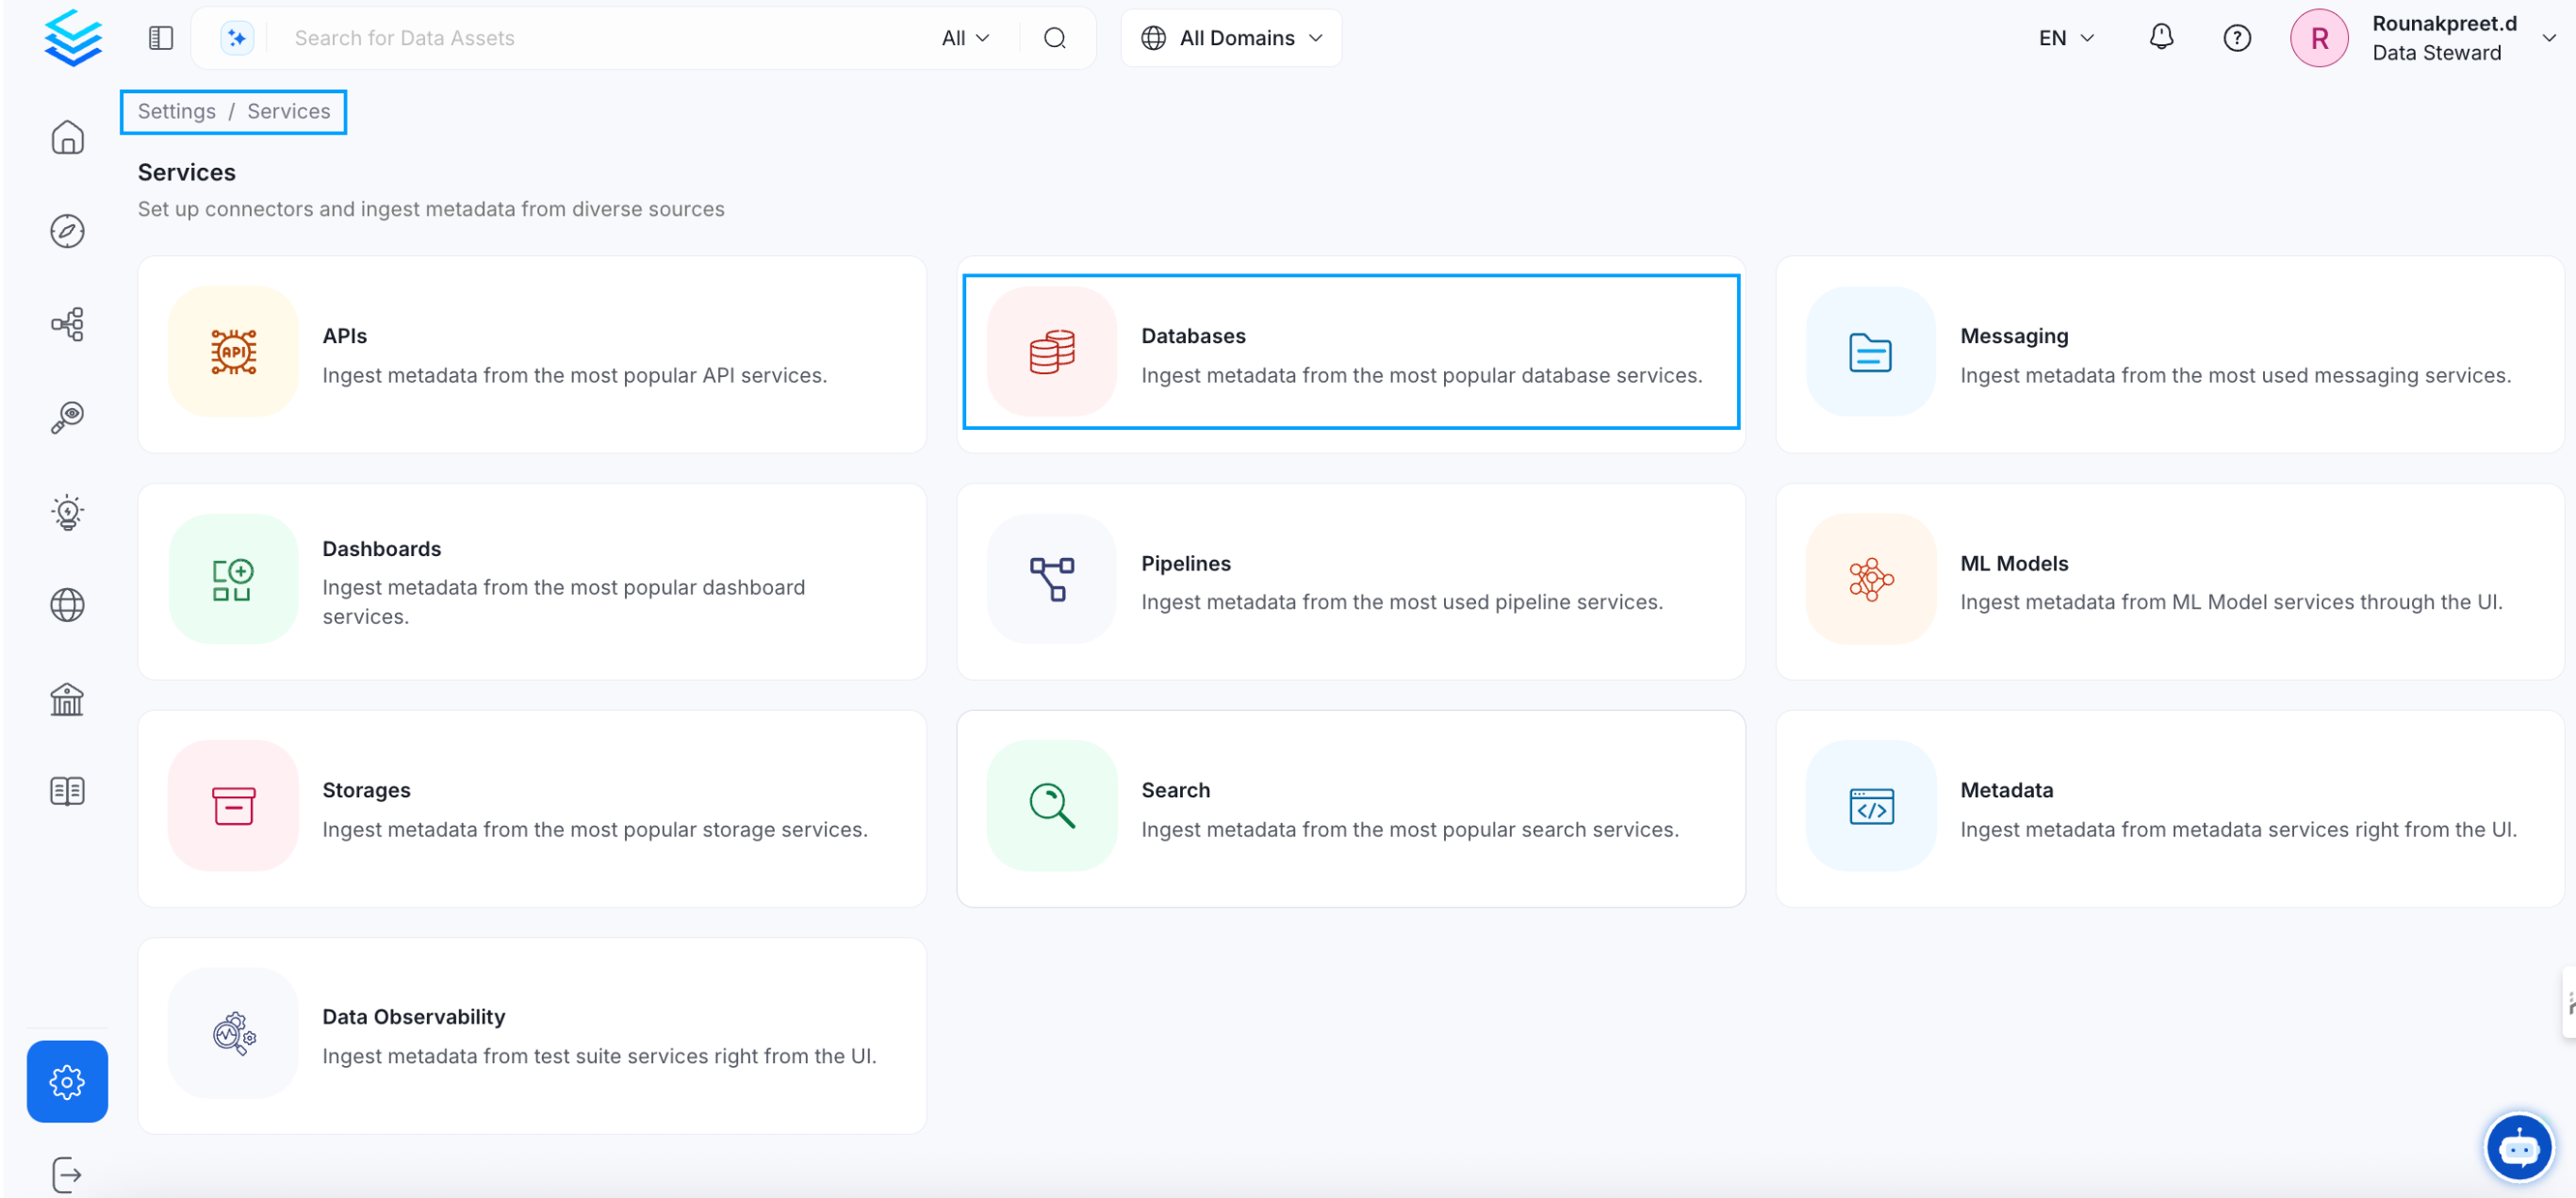
1. Visit the Services Page
Click Settings in the side navigation bar and then Services.
The first step is to ingest the metadata from your sources. To do that, you first need to create a Service connection first.
This Service will be the bridge between OpenMetadata and your source system.
Once a Service is created, it can be used to configure your ingestion workflows.
Select your Service Type and Add a New Service
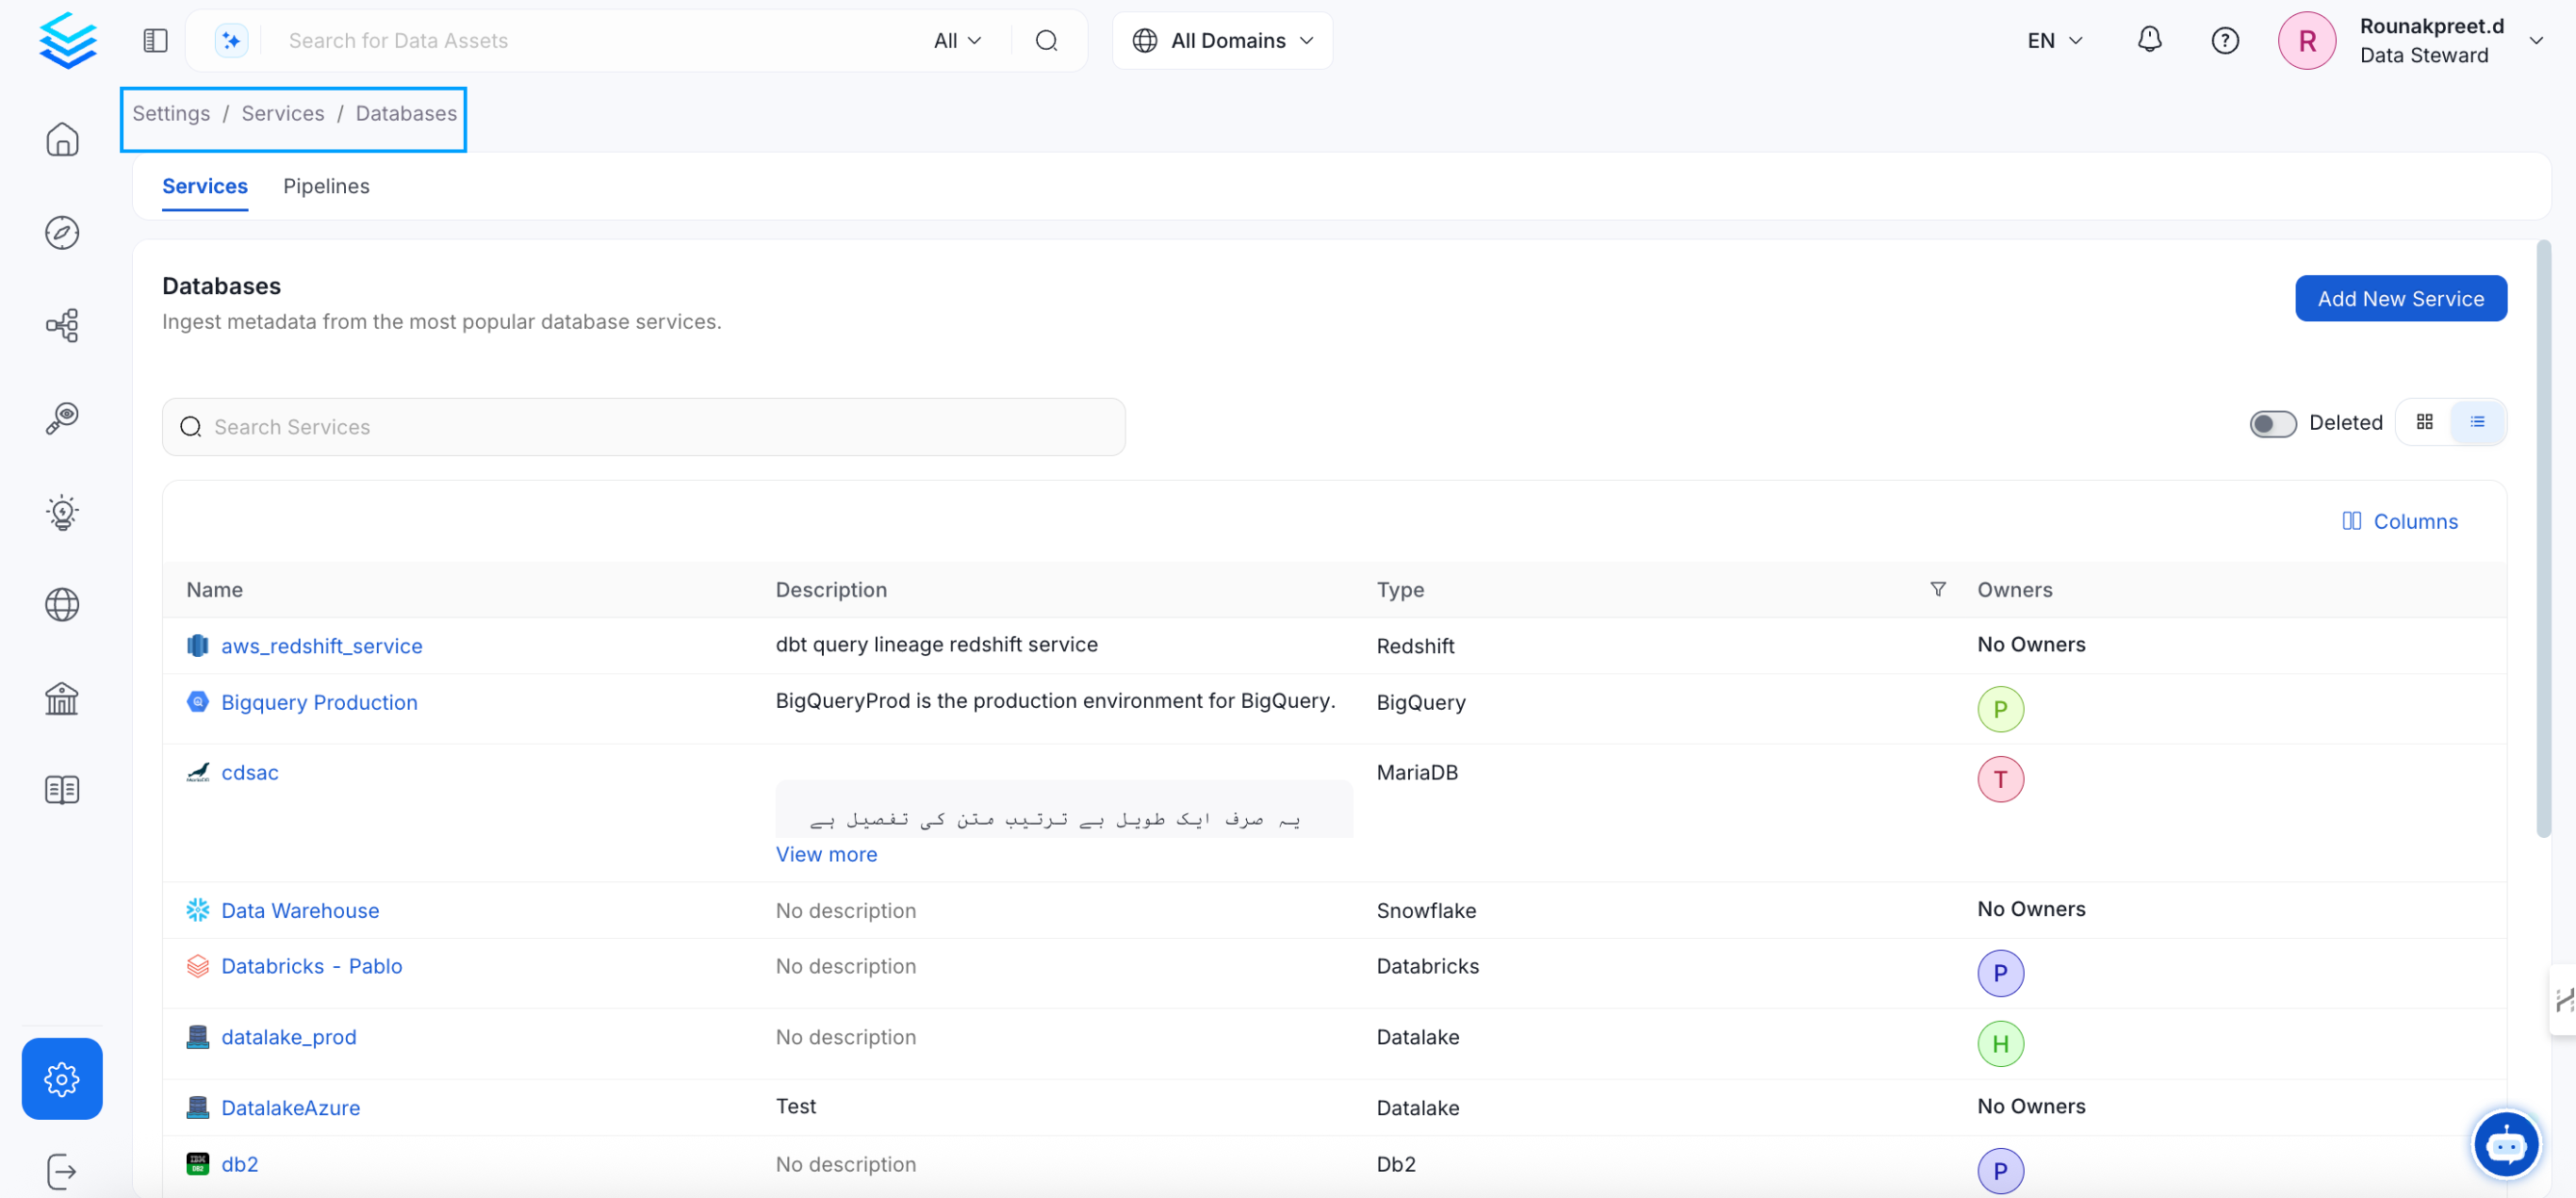
Add a new Service from the Services page
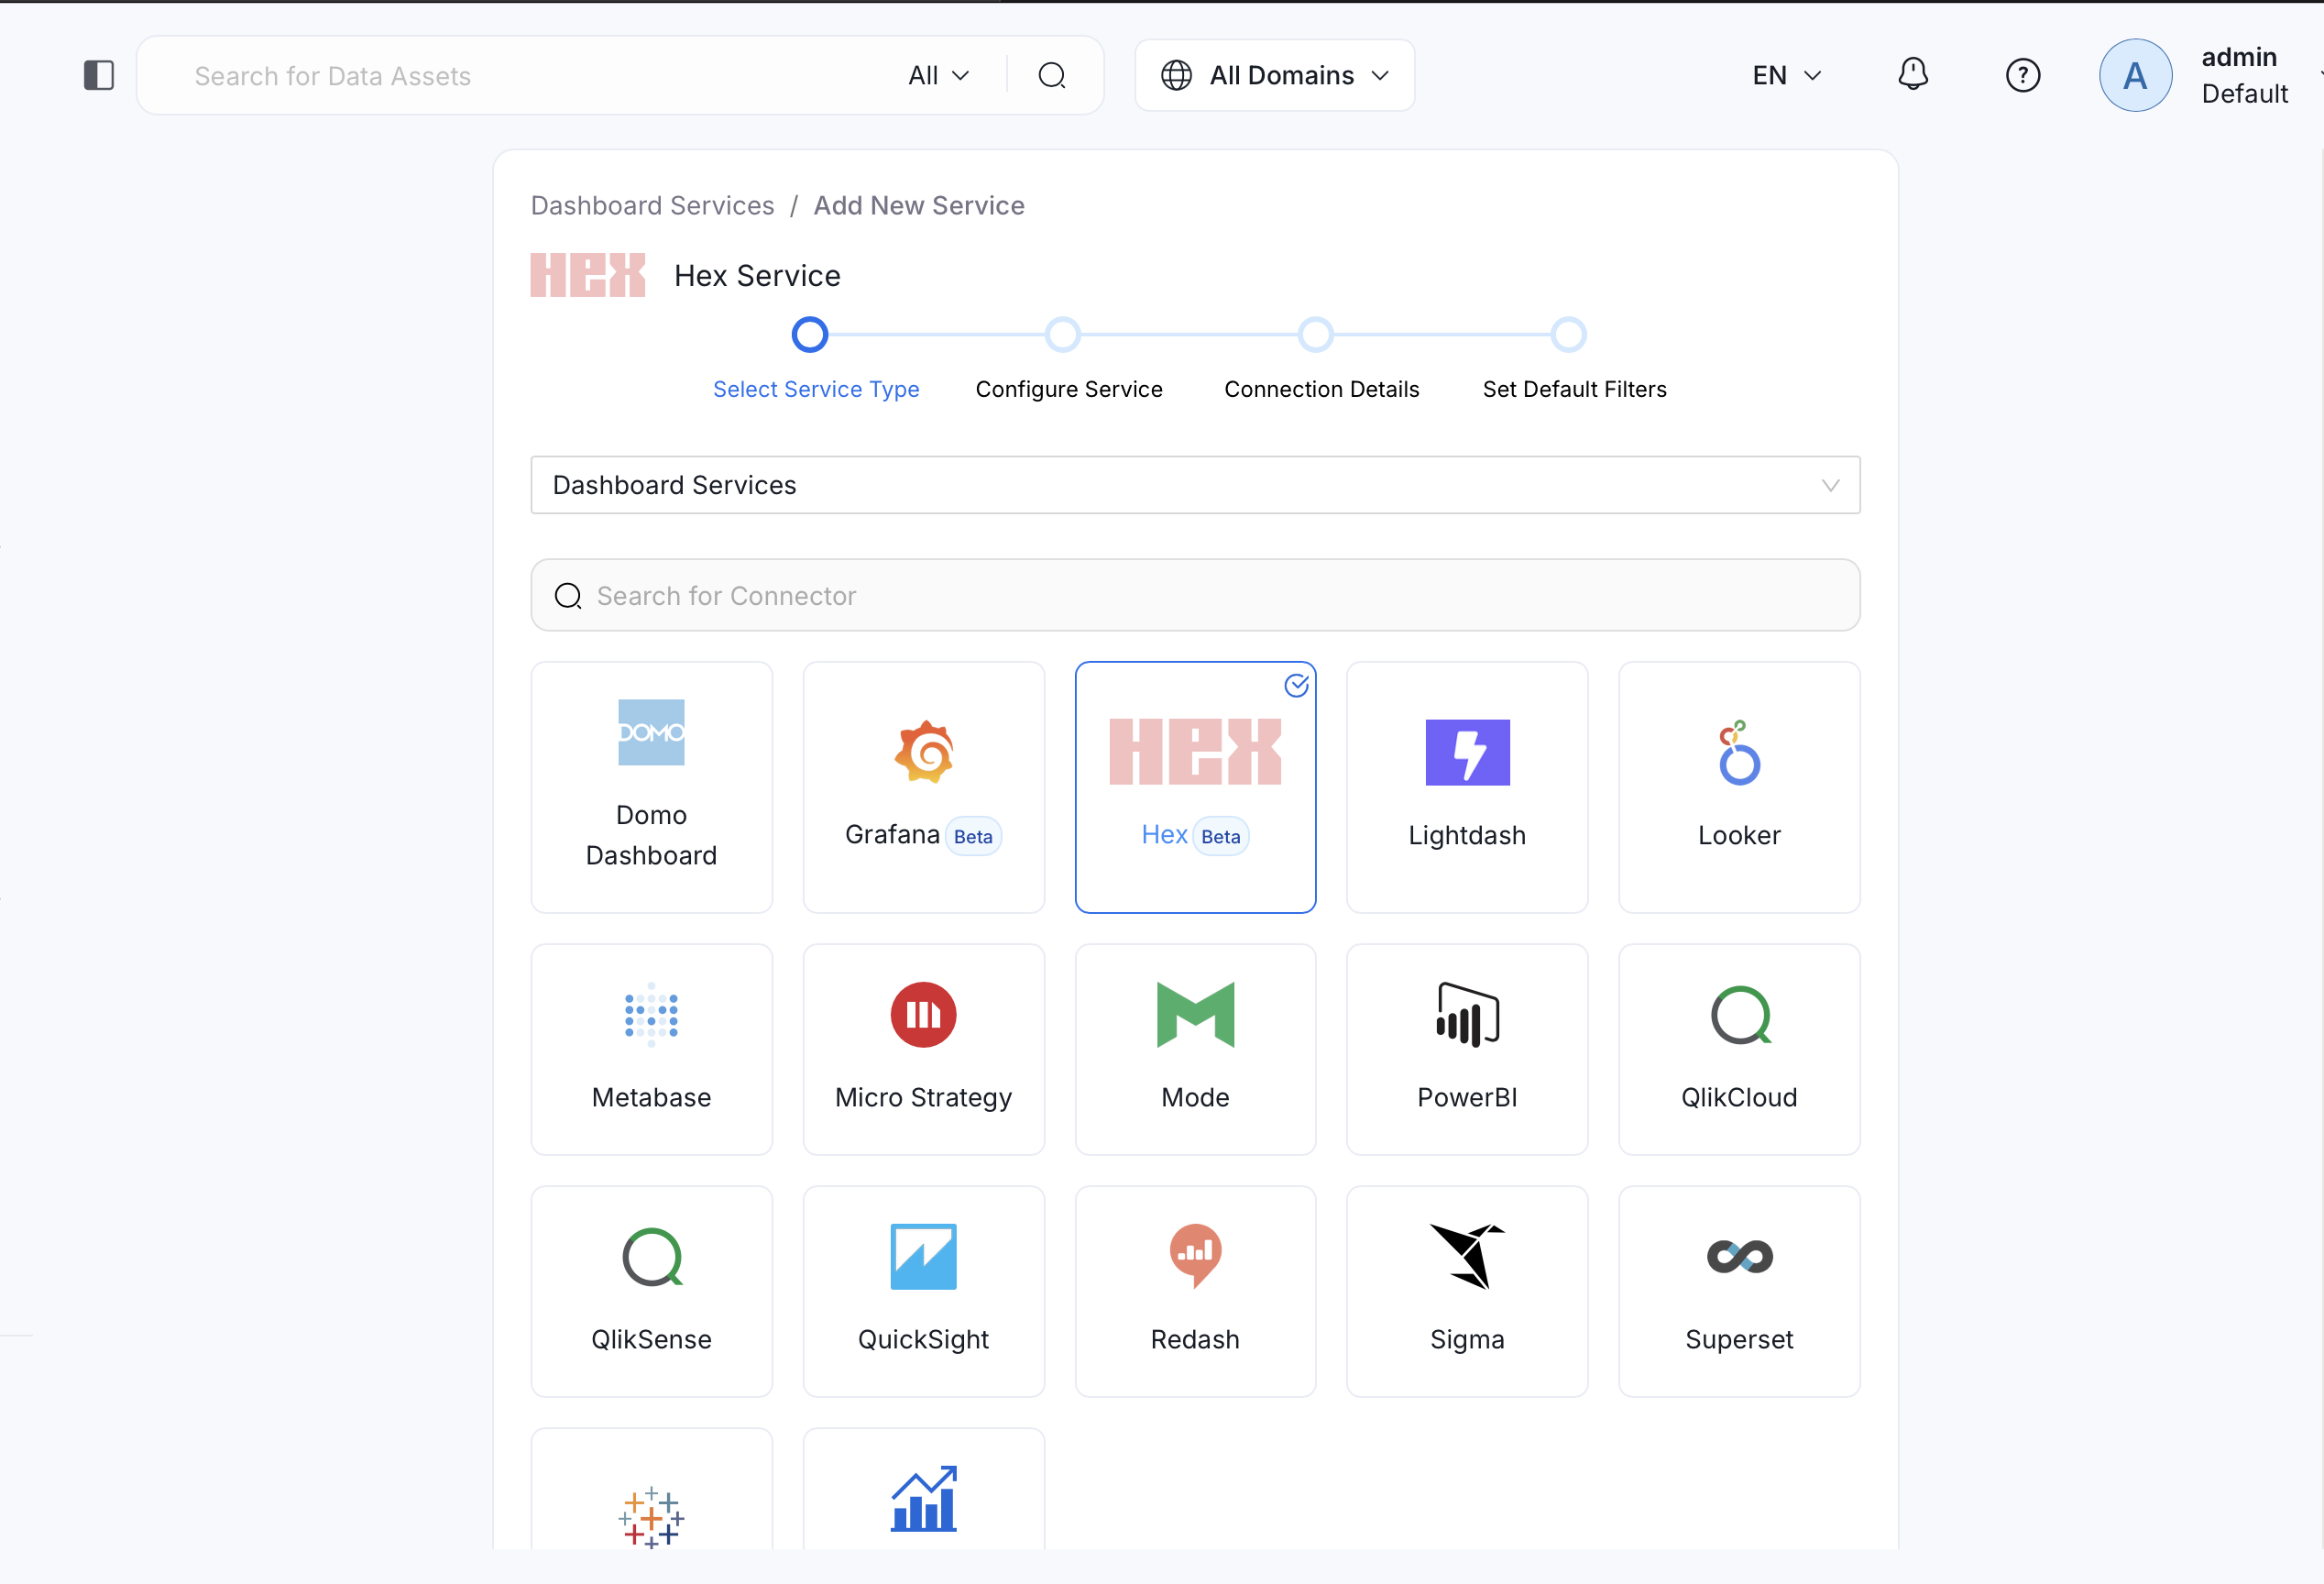
Select your Service from the list
4. Name and Describe your Service
Provide a name and description for your Service.
Service Name
OpenMetadata uniquely identifies Services by their Service Name. Provide a name that distinguishes your deployment from other Services, including the other Hex Services that you might be ingesting metadata from.
Note that when the name is set, it cannot be changed.
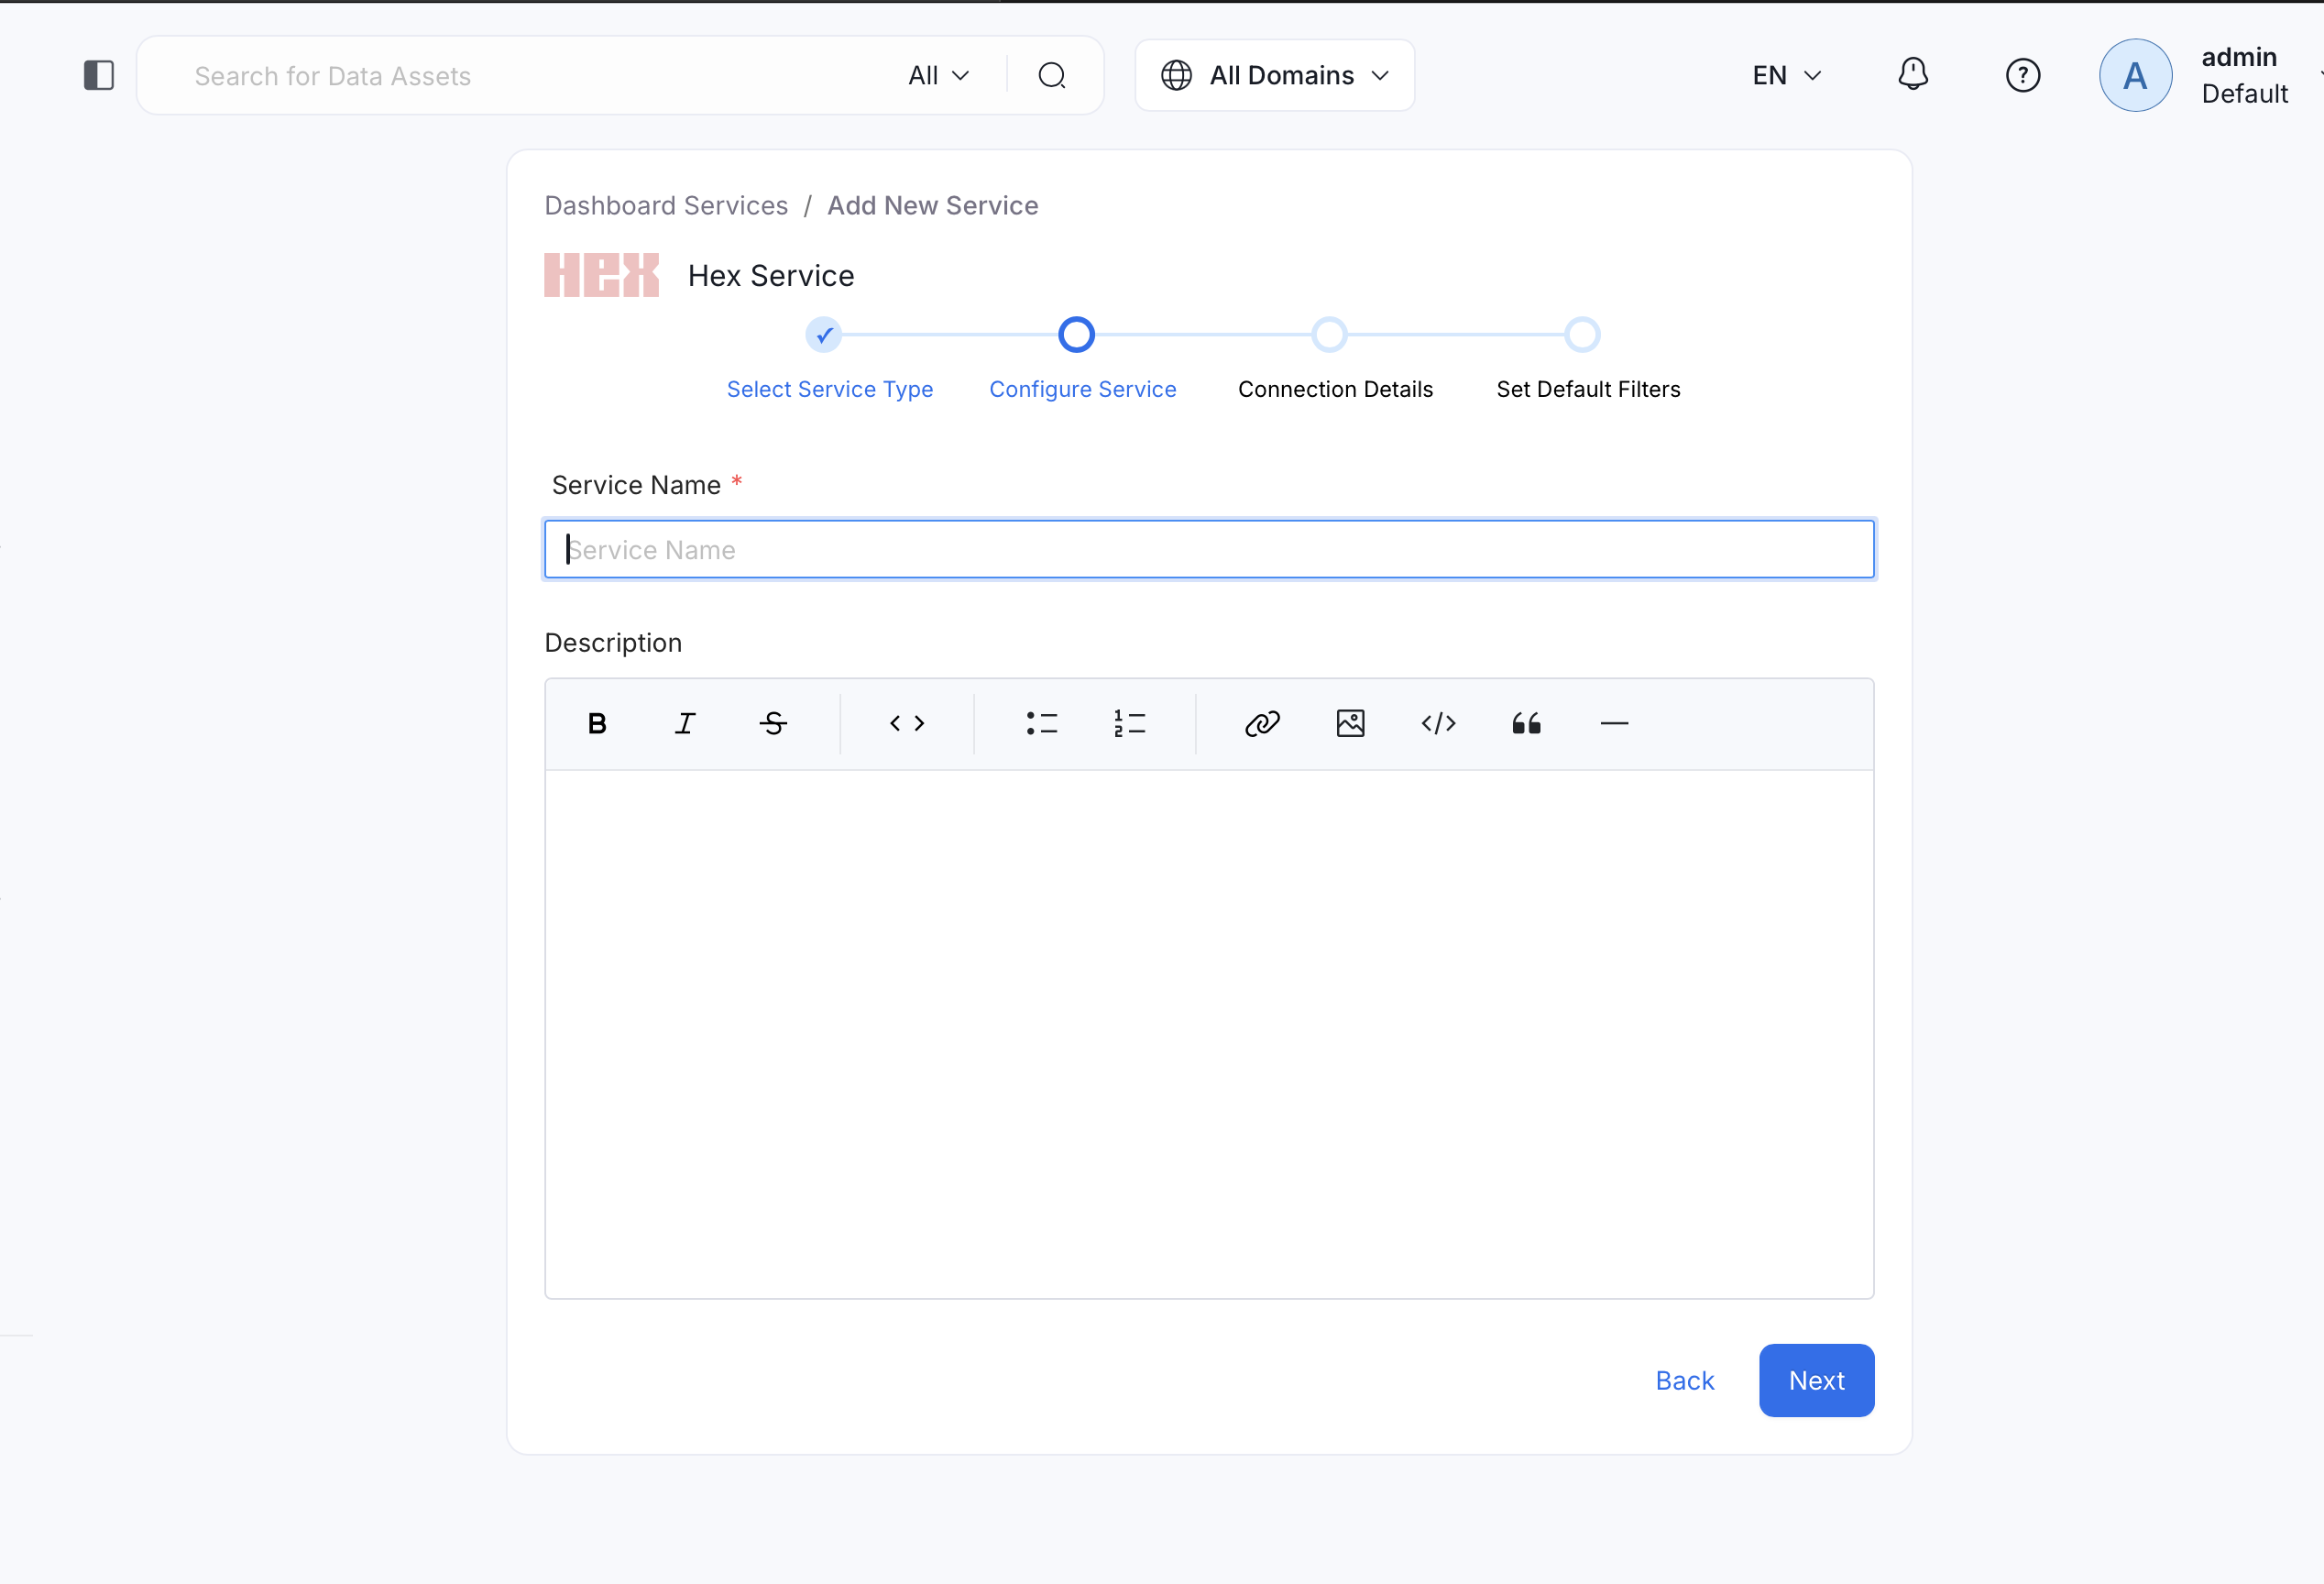
Provide a Name and description for your Service
5. Configure the Service Connection
In this step, we will configure the connection settings required for Hex.
Please follow the instructions below to properly configure the Service to read from your sources. You will also find helper documentation on the right-hand side panel in the UI.
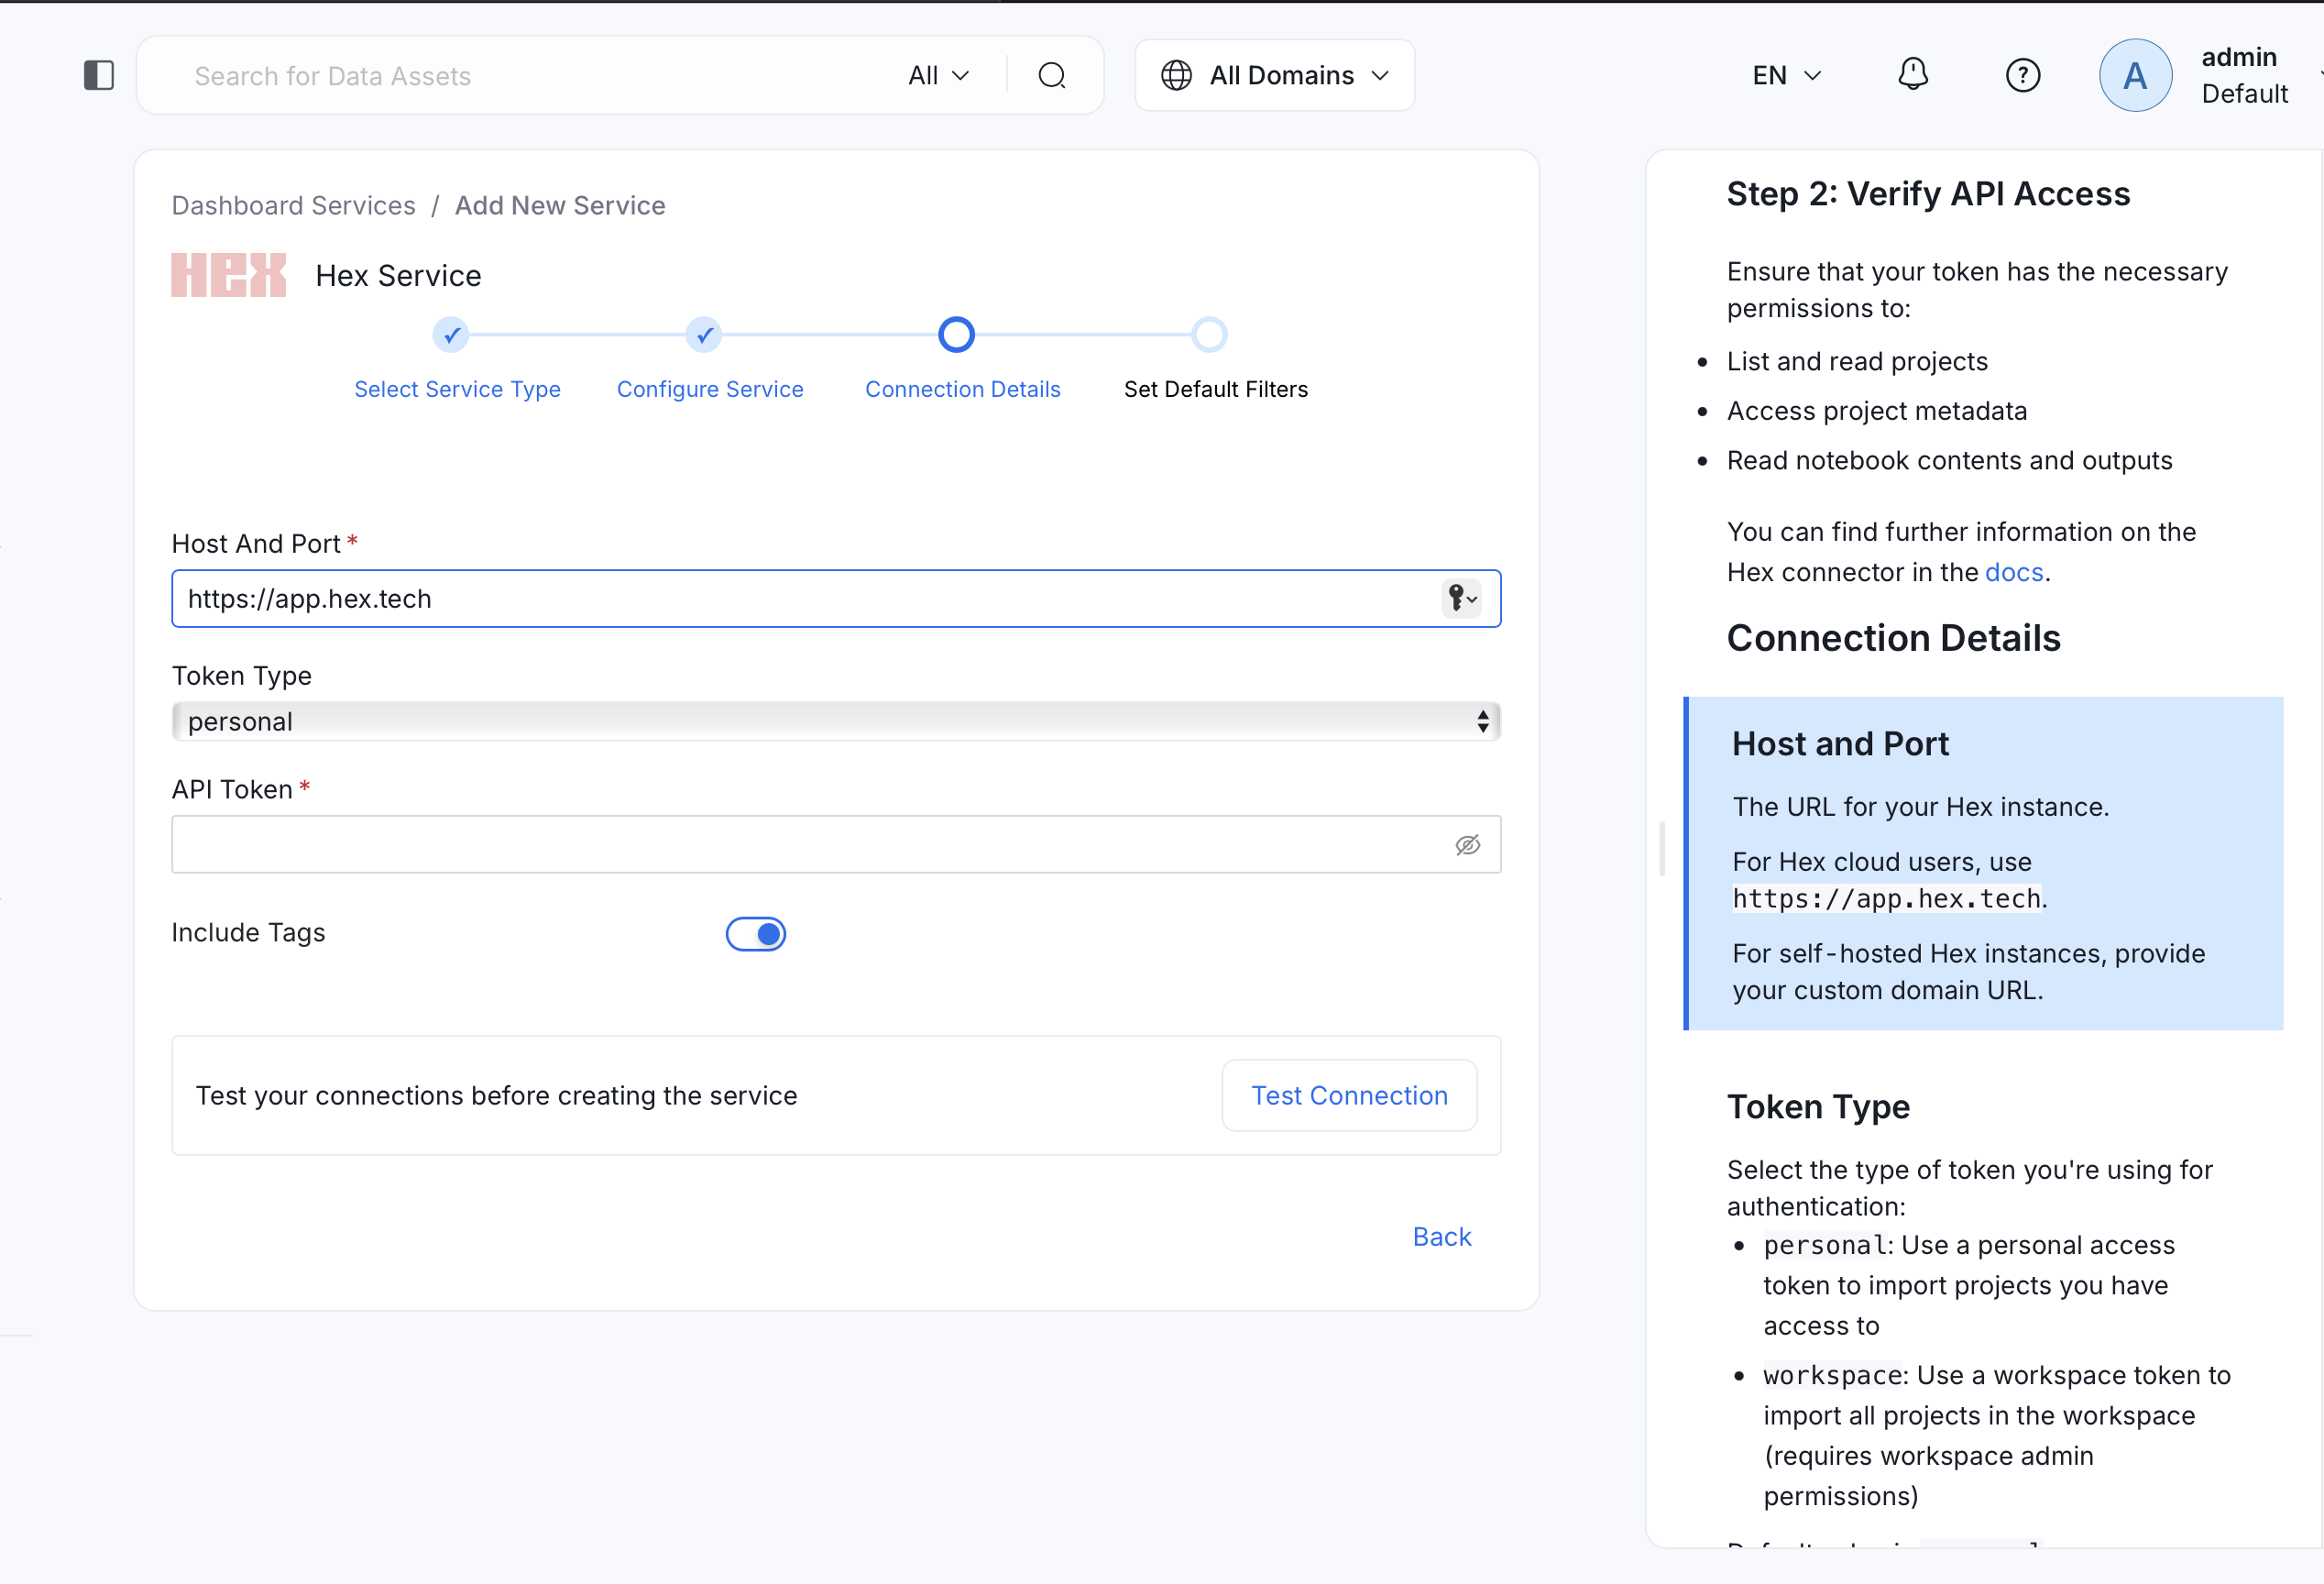
Configure the Service connection by filling the form
Connection Details
hostPort: URL to the Hex instance.
Provide the URL to your Hex instance. For Hex cloud users, use https://app.hex.tech.
For on-premise installations, provide your custom domain URL.
tokenType: Type of authentication token.
Select the type of token you're using:
- personal: Personal access token (default)
- workspace: Workspace-level token (requires admin privileges)
token: Hex API Token.
Provide the API token generated from your Hex account. This token is used for authentication with the Hex APIs.
To generate a token:
- Log into Hex
- Go to Account Settings > API Keys
- Create a new API key
- Copy the generated token
includeTags: Import Hex Categories and Status as Tags.
Enable this option to import Hex project categories and status as OpenMetadata tags. This helps in organizing and filtering your Hex projects within OpenMetadata.
By default, this is set to true.
Dashboard Filter Pattern:
Use regex patterns to include or exclude specific dashboards from ingestion. This helps you control which Hex projects are imported into OpenMetadata.
Examples:
- Include only production projects:
^prod-.* - Exclude test projects:
^(?!test-).*
6. Test the Connection
Once the credentials have been added, click on Test Connection and Save the changes.
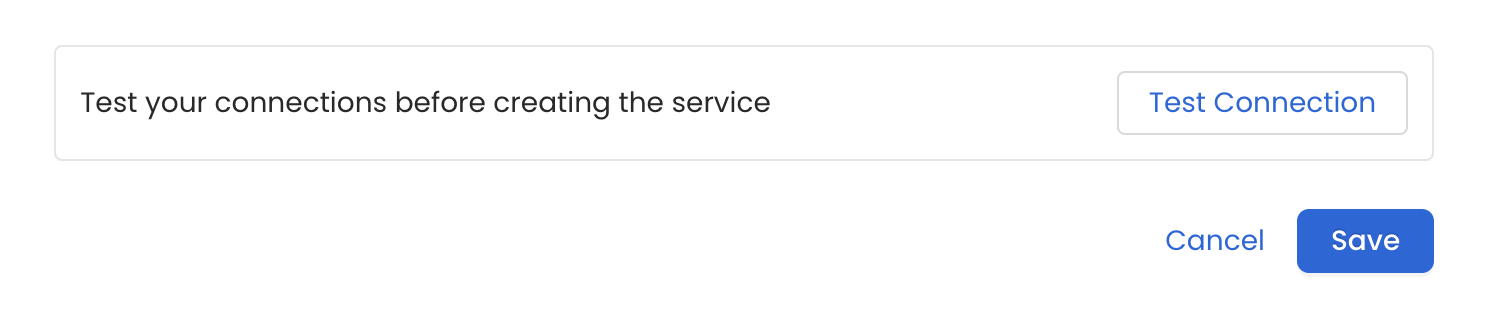
Test the connection and save the Service
7. Configure Metadata Ingestion
In this step we will configure the metadata ingestion pipeline, Please follow the instructions below
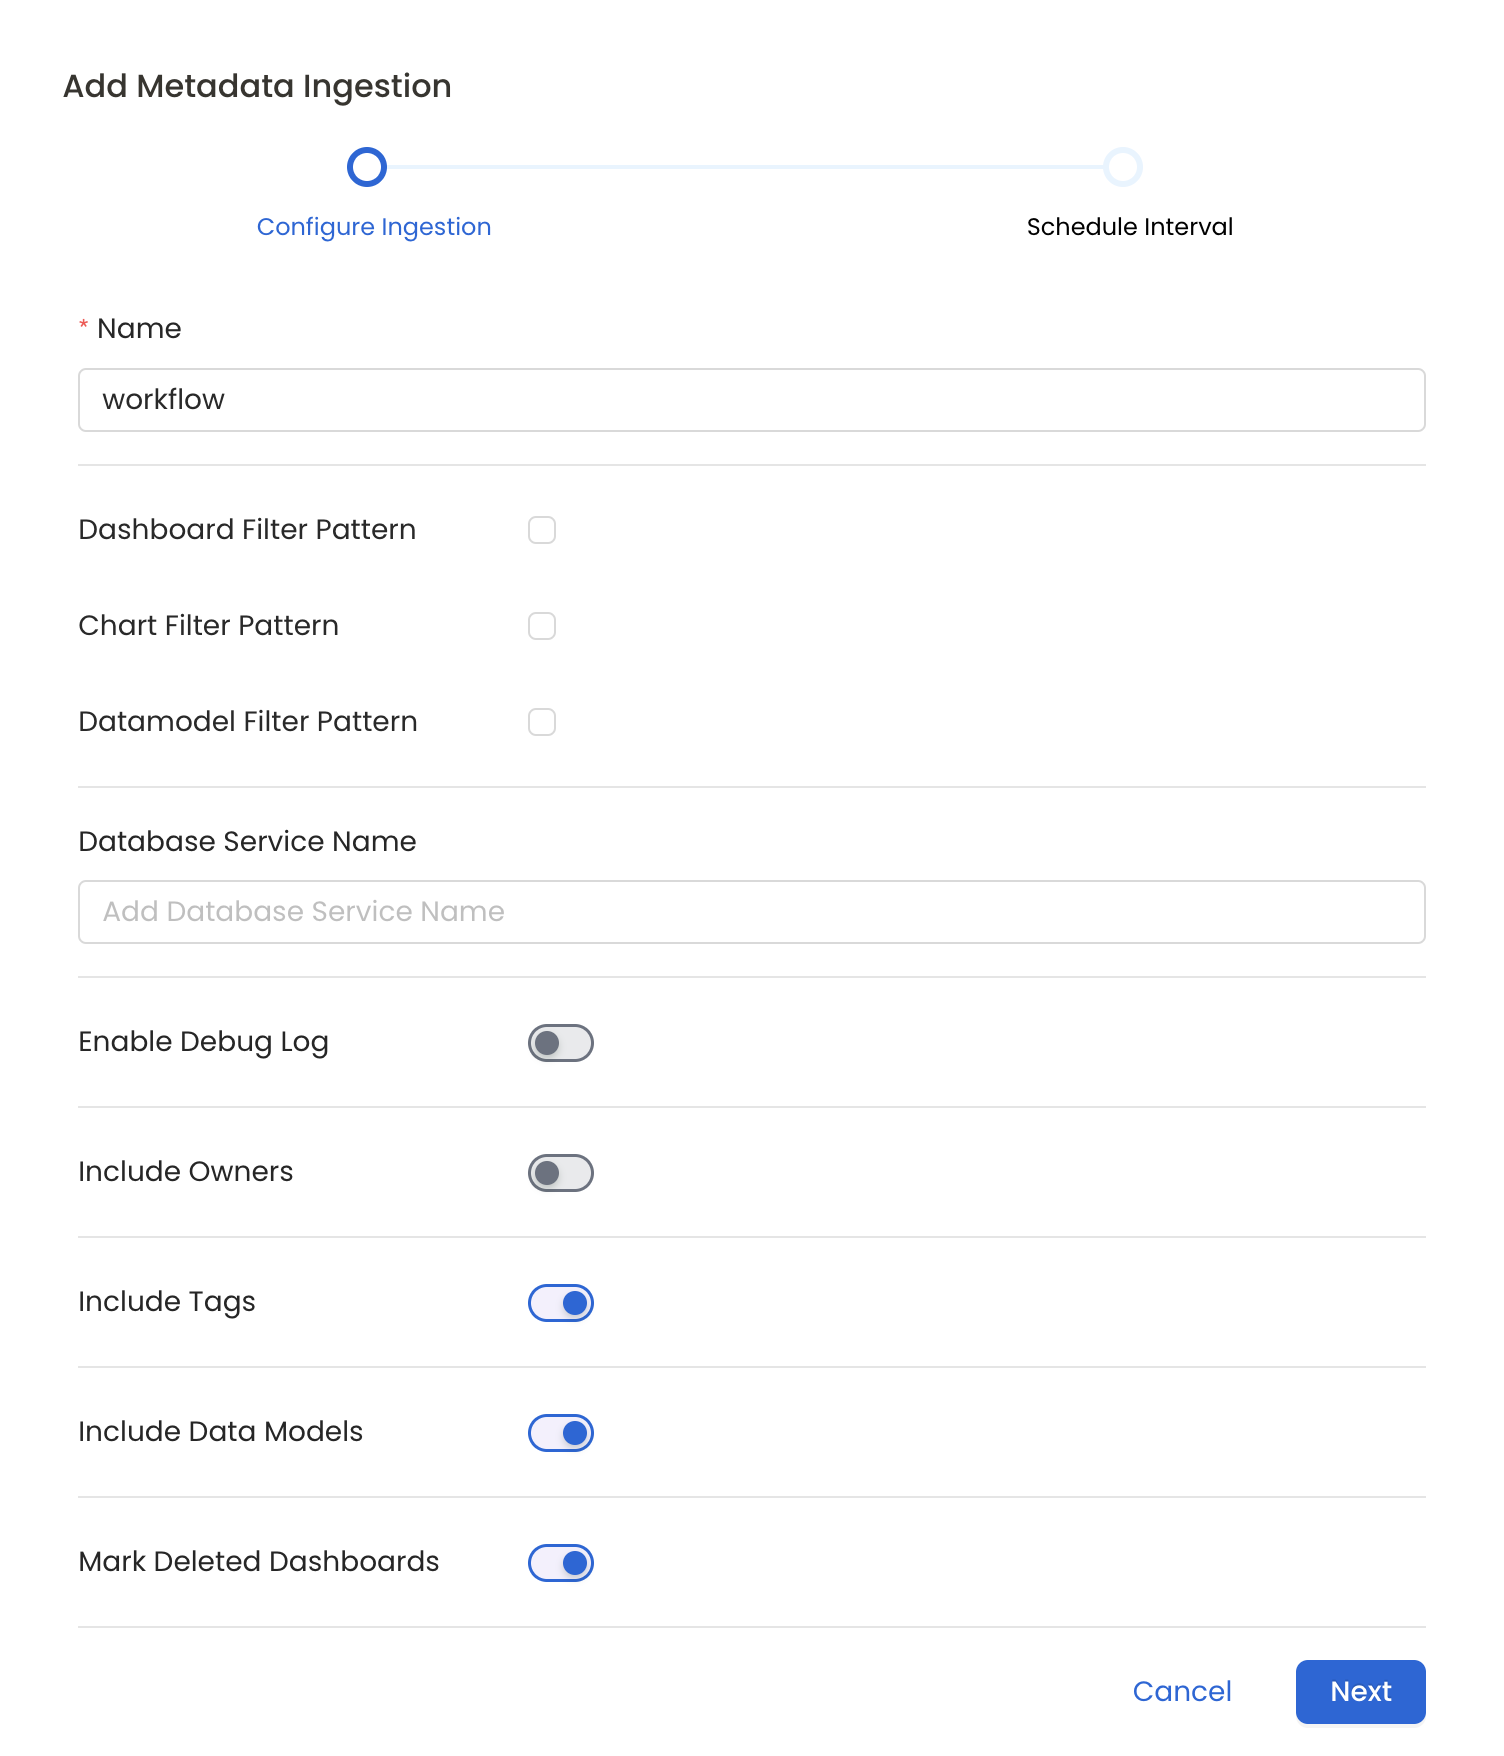
Configure Metadata Ingestion Page
Metadata Ingestion Options
- Name: This field refers to the name of ingestion pipeline, you can customize the name or use the generated name.
- Dashboard Filter Pattern (Optional): Use it to control whether to include dashboard as part of metadata ingestion.
- Include: Explicitly include dashboards by adding a list of comma-separated regular expressions to the 'Include' field. OpenMetadata will include all dashboards with names matching one or more of the supplied regular expressions. All other dashboards will be excluded.
- Exclude: Explicitly exclude dashboards by adding a list of comma-separated regular expressions to the 'Exclude' field. OpenMetadata will exclude all dashboards with names matching one or more of the supplied regular expressions. All other dashboards will be included.
- projectFilterPattern: Filter the dashboards, charts and data sources by projects. Note that all of them support regex as include or exclude. E.g., "My project, My proj.*, .*Project".
We filter the projects by concatenating the entire project hierarchy using dot notation
(e.g., Project1.NestedProjectA.OtherProject).
Make sure the regex filter pattern accounts for this fully-qualified format.
- Chart Pattern (Optional): Use it to control whether to include charts as part of metadata ingestion.
- Include: Explicitly include charts by adding a list of comma-separated regular expressions to the 'Include' field. OpenMetadata will include all charts with names matching one or more of the supplied regular expressions. All other charts will be excluded.
- Exclude: Explicitly exclude charts by adding a list of comma-separated regular expressions to the 'Exclude' field. OpenMetadata will exclude all charts with names matching one or more of the supplied regular expressions. All other charts will be included.
- Data Model Pattern (Optional): Use it to control whether to include data modes as part of metadata ingestion.
- Include: Explicitly include data models by adding a list of comma-separated regular expressions to the 'Include' field. OpenMetadata will include all data models with names matching one or more of the supplied regular expressions. All other data models will be excluded.
- Exclude: Explicitly exclude data models by adding a list of comma-separated regular expressions to the 'Exclude' field. OpenMetadata will exclude all data models with names matching one or more of the supplied regular expressions. All other data models will be included.
- Db Service Prefixes (Optional): Enter the names of Database Services which are already ingested in OpenMetadata to create lineage between dashboards and database tables.
- Enable Debug Log (toggle): Set the 'Enable Debug Log' toggle to set the default log level to debug.
- Include Owners (toggle): Set the 'Include Owners' toggle to control whether to include owners to the ingested entity if the owner email matches with a user stored in the OM server as part of metadata ingestion. If the ingested entity already exists and has an owner, the owner will not be overwritten.
- Include Tags (toggle): Set the 'Include Tags' toggle to control whether to include tags in metadata ingestion.
- Include Data Models (toggle): Set the 'Include Data Models' toggle to control whether to include tags as part of metadata ingestion.
- Mark Deleted Dashboards (toggle): Set the 'Mark Deleted Dashboards' toggle to flag dashboards as soft-deleted if they are not present anymore in the source system.
- Include Draft Dashboard (toggle): Set the 'Include Draft Dashboard' toggle to include draft dashboards. By default it will include draft dashboards.
8. Schedule the Ingestion and Deploy
Scheduling can be set up at an hourly, daily, weekly, or manual cadence. The timezone is in UTC. Select a Start Date to schedule for ingestion. It is optional to add an End Date.
Review your configuration settings. If they match what you intended, click Deploy to create the service and schedule metadata ingestion.
If something doesn't look right, click the Back button to return to the appropriate step and change the settings as needed.
After configuring the workflow, you can click on Deploy to create the pipeline.
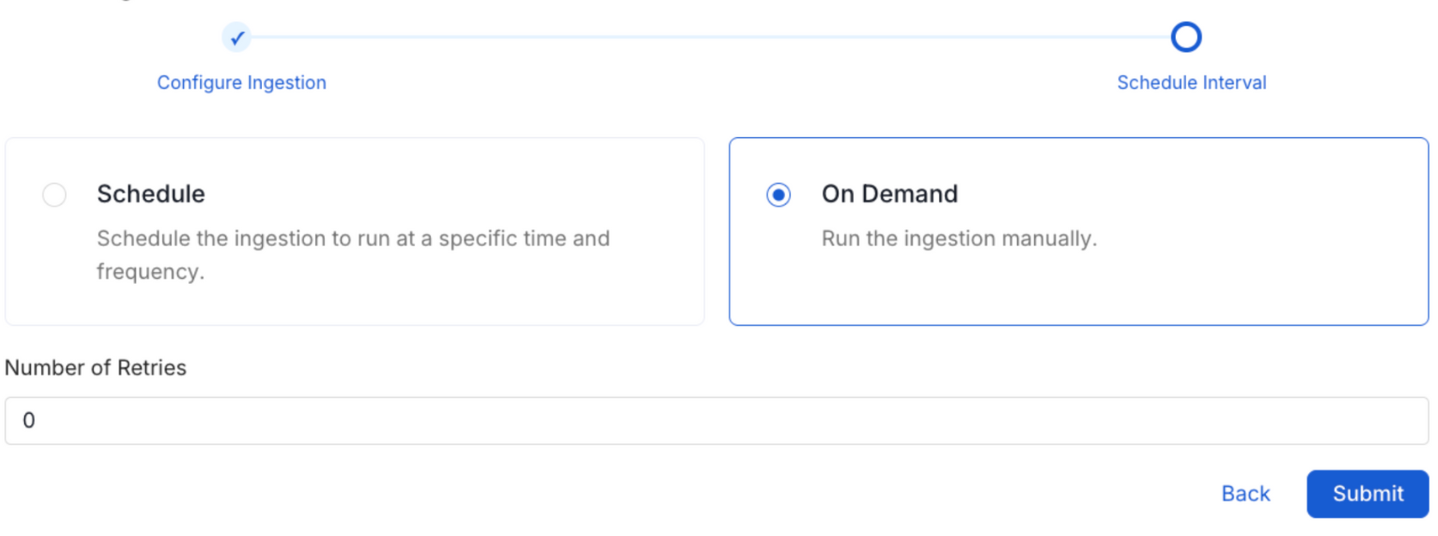
Schedule the Ingestion Pipeline and Deploy
Lineage
Hex connector extracts lineage information by:
- Warehouse Query History: Directly queries data warehouse logs (Snowflake, BigQuery, Databricks, Redshift, etc.) to find queries executed by Hex
- Hex Metadata Identification: Identifies Hex-originated queries using metadata comments embedded by Hex containing project IDs
- SQL Parsing: Analyzes the discovered SQL queries to extract upstream table dependencies
The lineage information helps you understand:
- Which data warehouse tables are actually queried by each Hex project
- Real data usage patterns based on executed queries
- Impact analysis when making changes to underlying data sources
Note: The connector does not use Hex APIs for lineage. Instead, it discovers lineage by analyzing actual queries executed in your data warehouses, providing more accurate data dependency information.
Warehouse Query Log Requirements
For lineage extraction to work, query logging must be enabled in your data warehouse:
Snowflake
- Requires access to
SNOWFLAKE.ACCOUNT_USAGE.QUERY_HISTORY - Query history is automatically maintained by Snowflake
BigQuery
- Requires access to
INFORMATION_SCHEMA.JOBS_BY_PROJECT - Query history is automatically maintained by BigQuery
MySQL
- Requires general_log to be enabled:
- Grant access to
mysql.general_logtable
Databricks
- Requires access to
system.query.history - Query history is automatically maintained
Redshift
- Requires access to
stl_querysystem table - Query history is automatically maintained
Other Warehouses
- Athena: Access to query history via CloudTrail or S3 logs
- ClickHouse: Access to
system.query_logtable
Troubleshooting
Common Issues
Authentication Failures
- Verify that your API token is valid and hasn't expired
- Check that the token type matches your access level (personal vs workspace)
- Ensure the API token has necessary permissions
Missing Projects
- For personal tokens: Verify you have access to the projects
- For workspace tokens: Confirm admin privileges
- Check the dashboard filter pattern configuration
Connection Timeouts
- Verify the hostPort URL is correct
- Check network connectivity to Hex
- For on-premise installations, ensure firewall rules allow access
Rate Limiting
- Hex APIs may have rate limits
- Consider adjusting the ingestion schedule if you encounter rate limit errors
- Contact Hex support if persistent rate limiting issues occur